Cincinnati: How often is it Above 90°F?
Weather Analysis for Cincinnati
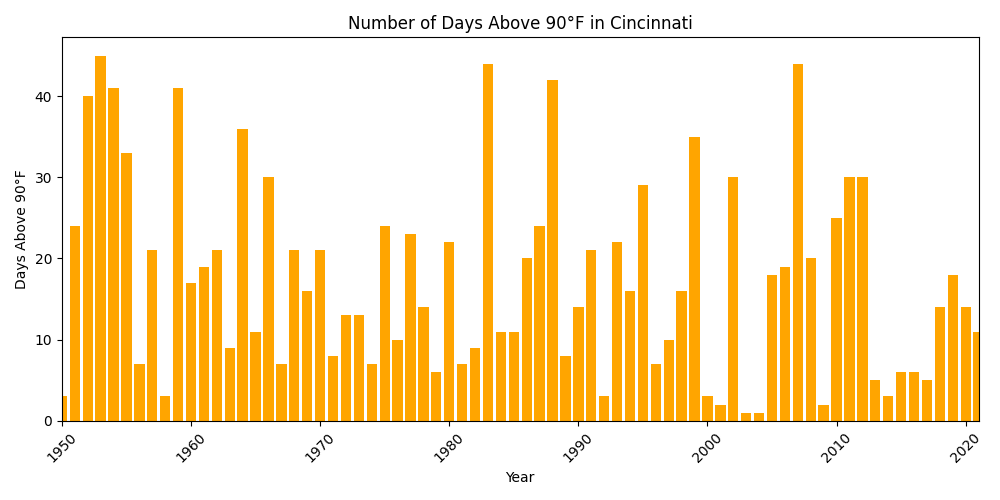
Cincinnati has experienced significant weather trends in terms of the number of days above 90°F. From 1950 to 2021, the average number of days above 90°F was 17.53. However, the year 1953 stood out as the hottest year, with a remarkable 45 days exceeding the 90°F mark. This data highlights the city's varying climate throughout the years and the impact it may have on residents' everyday lives.